Sunday, July 31, 2011

Augmenting Reality

The next thing was to start looking at ways to augment reality, i.e. a way to morph what is real into something else, or an aspect of it. This is how I understood it anyway, but the tutors used the Belgian artist Ben Heine to eloborate further, and how he 'augments reality.' Here's some examples of his amazing artwork:


Sticking on the idea of 'waking up,' the next task was to choose a place on the site where we would want to wake up, and then augment the reality in the way Heine has by drawing in our beds there.

I chose the tall metal sculpture at the large park beside Vector Arena


At first the idea was to have a hammock underneath the sails, so that when I wake up the first thing I would see was this amazing pattern above me (This picture really doesn't do it justice), where in the morning the sun shines at particular angle so that the light is refracted and bent and forms these peculiar shadows on the bottom sail. It is something surreal, as if i've woken up but still dreaming, and is a peaceful sight to wake up to. Some people may find the view ugly, and that it is blocking the vast view of the sky which would be much more interesting to wake up to. Nevertheless, I wasn't able to express this idea to the tutors on Monday, and so I revisited the sculpture after the crit to recapture new ideas and inspiration to inform my detail model



Saturday, July 30, 2011

Waking up


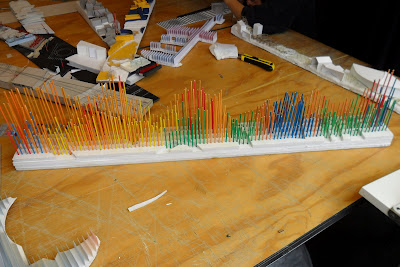
^ The end result of the section model of noise


The beginning of the next project invoked a simple question - "Where in this section would be interesting to wake up, and why?"

To do this took a lot of exploration, but we came up with a place just behind a set of residential apartments, where the train travels just beside on the hill. Interesting because you could wake up to this peaceful quiet area with only birds and warm sunlight, which could immediately be ruined by the shadow of the train driving past and the thunder it makes travelling on the tracks.

Although we made a 1:100 model, we talked about it for a few minutes and they were never looked at again.

Also now we have to cut up our sections and join them together as best as we can. Seems impossible with 10 other models crossing the exact same spot...

Friday, July 29, 2011

Expressing Noise values

The first idea that came to mind was a spectrogram (the noise amplitude displaying device on your stereo).


But this was way too limited, so we used it to inform our idea, which involved a colloborative inspiration from this, and the video "house of cards" from Radiohead.

http://www.youtube.com/watch?v=8nTFjVm9sTQ


The video wasnt shot by a normal video camera, but 3D plotting devices that used laser to calculate the distance away from the source of the area surrounding. This was then converted into a visualization.
Morphing these two ideas together gave us the result of expressing the data in a 3D spectrogram, where our categories can be shown with colour, and the noise level by height.

Since we initially thought of showing the 'mood' of the noise (changed our mind in the end because this was too subjective), the colour of the categories would relate to the mood of the source, e.g. nature being a blue which is peaceful and calming, as opposed to red for Construction noise which is disruptful and annoying. Therefore we came up with this colour code:

Construction
Transport
Commercial
Residential
Nature
Industrial

Figuring out the material for the project employed the use of trial and error: Plaster would take too much time, may not mould as we want it, and could absorb the water-based paint; Clay has the same problem as plaster, that moulding it right would take too long, and the amount we'd need would be expensive; toothpicks were at first the only solution we had, except that there was a height limitation. We then got the idea to use skewers, which were thicker and longer, meaning we could show the undulating noise levels much more dramatically


Thursday, July 28, 2011

Measuring Noise

We concluded that for noise there would no way to measure objectively, since we didn't have access toany technical equipment and it would be too expensive to hire any out. So we decided to measure in 2 ways: The amount of noise in a particular area on a scale of 10; and the source of the noise and whether it was commercial, transport, residential, natural or industrial. Obviously most of the time there will be more than 1 source, in which case we would approximate how much of the noise was coming from whichever category, e.g. 80% transport and 20 % residential.


We took 20 different measurements for 20 different areas, and recorded them as mentioned before


Measuring a site

The first project was to measure an aspect of the site: a triangular section of downtown auckland. This was a part of Auckland that I wasn't entirely familiar with, so on the first day it also gave me a new insight of Auckland CBD besides just Queen Street and High street.


This part of the city w
as mainly industrial and commercial, but what I was really interested in most was how loud and noise-polluted the area was. This gave spark to our idea (working in partners) to measure not only noise pollution, but also the areas where this large amount of noise from transport, commercial and industrial areas were blocked. The gave us a good idea of where the noise barriers were and ultimately places for recereation such as parks, or residential buildings.

The issues then was to decide how to express the collected data in a physical way that's not complicated, and how to measure this noise.